Mapping the songwriter family tree with small data
Adapted from my talk at Small Data SF 2025
This post is adapted from my talk at Small Data SF on November 5, 2025, "Uncharted: Building a Semantic Layer + MCP to Map 1.7M Songwriter Connections with Claude Code." Watch the talk on YouTube.
If you've heard of Kanye West, Taylor Swift, Quincy Jones, or Justin Vernon, you've been touched by a problem most people never pay attention to: who wrote the song, and who they wrote it with. This is about how I went after that problem with small data.
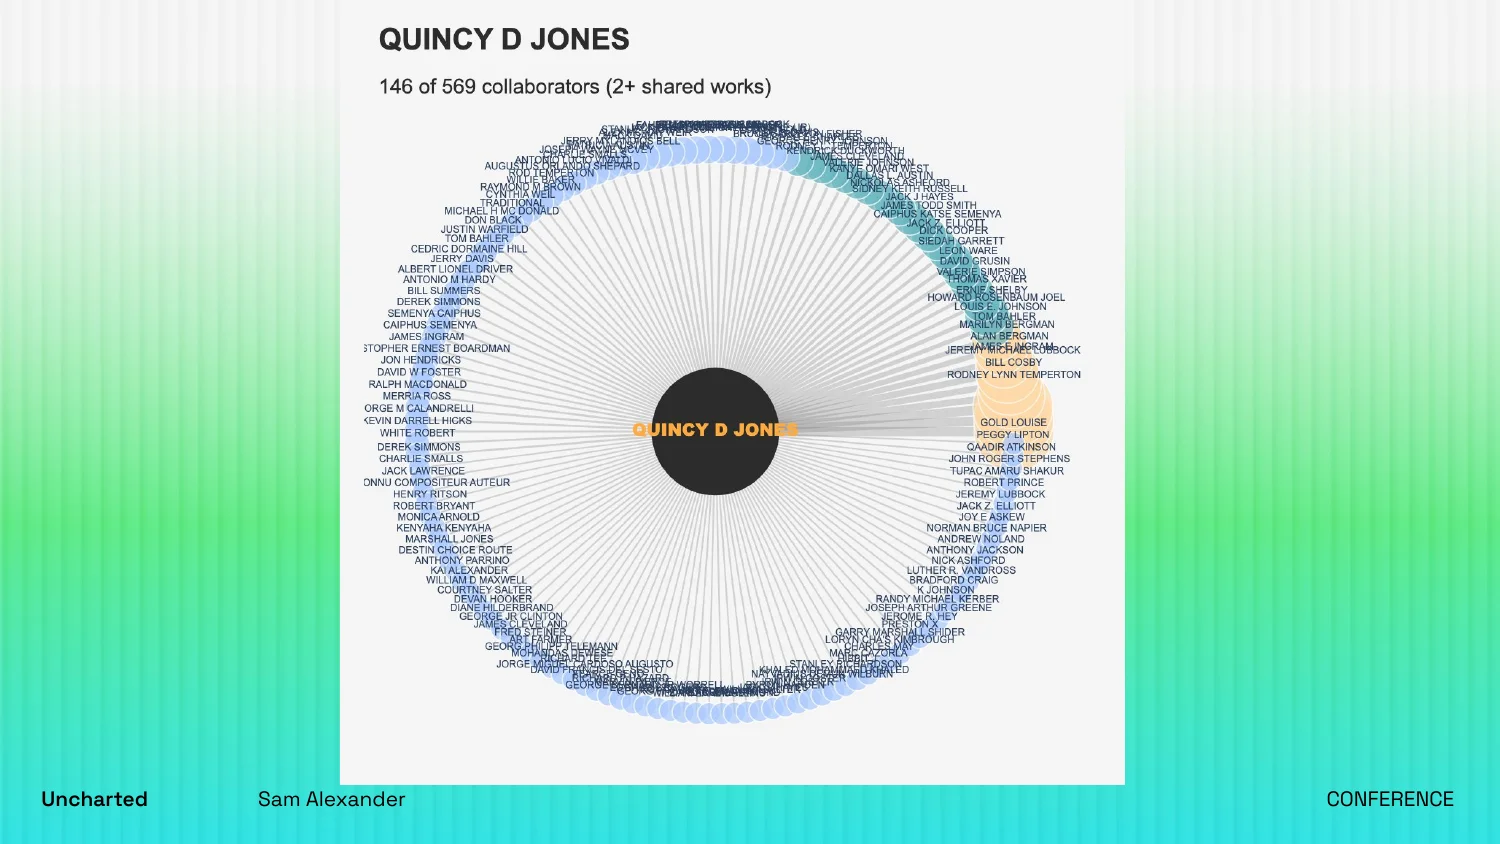
This is an ego graph of Quincy Jones's songwriting network. Quincy sits in the middle, surrounded by 146 of his 569 collaborators, the ones who share two or more songwriting credits with him. The softer gold marks the long-term people, the ones who collaborated with him across many different works.
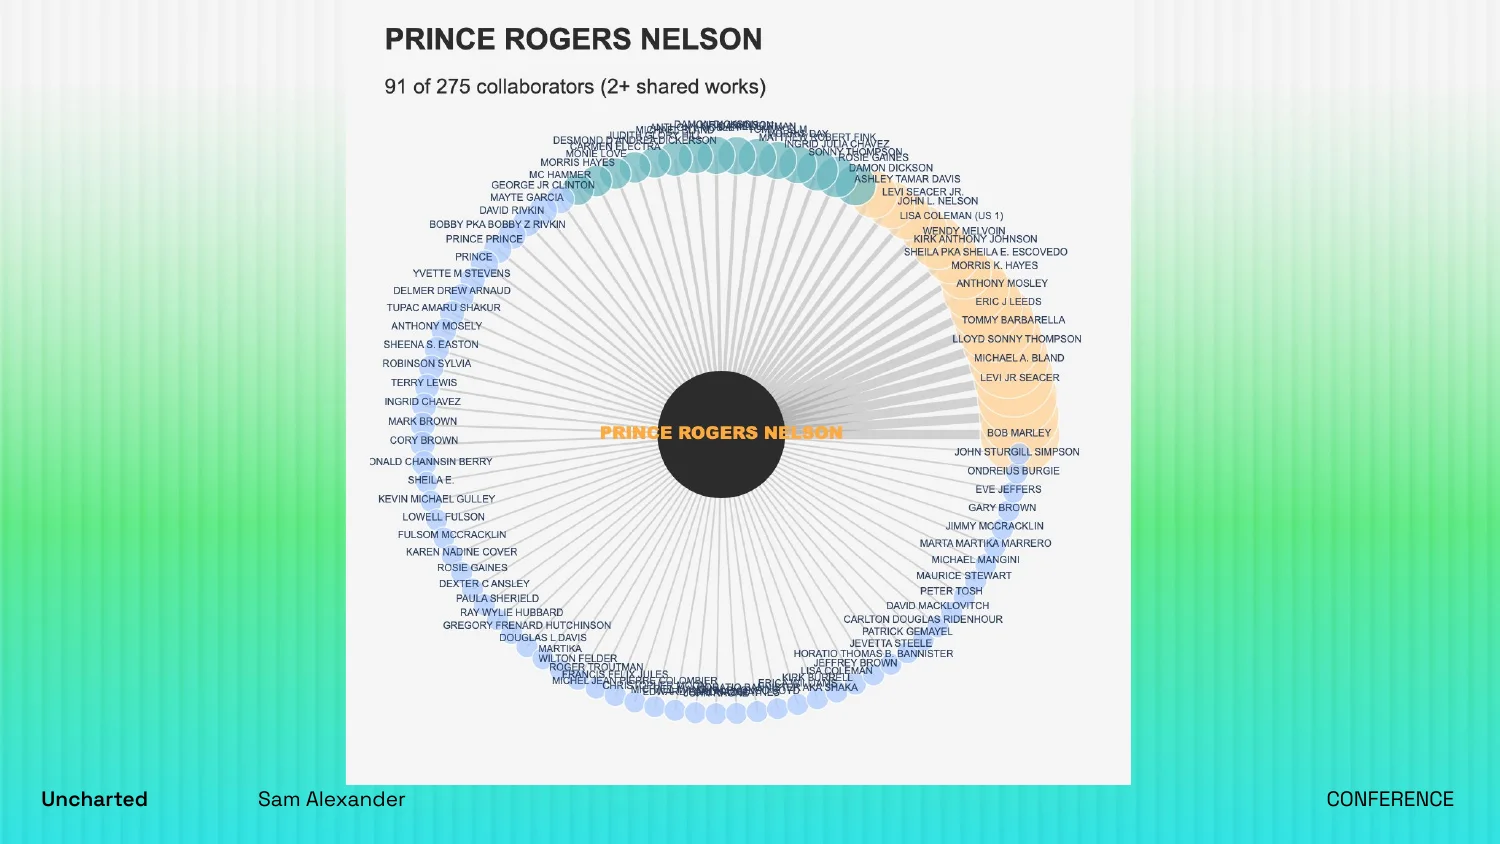
Here's the same view for Prince Rogers Nelson. He had a really core group of musicians and songwriters who worked with him throughout his career, and it made a big difference in how he collaborated.
Both of those are older songwriters. Here's a more modern artist...
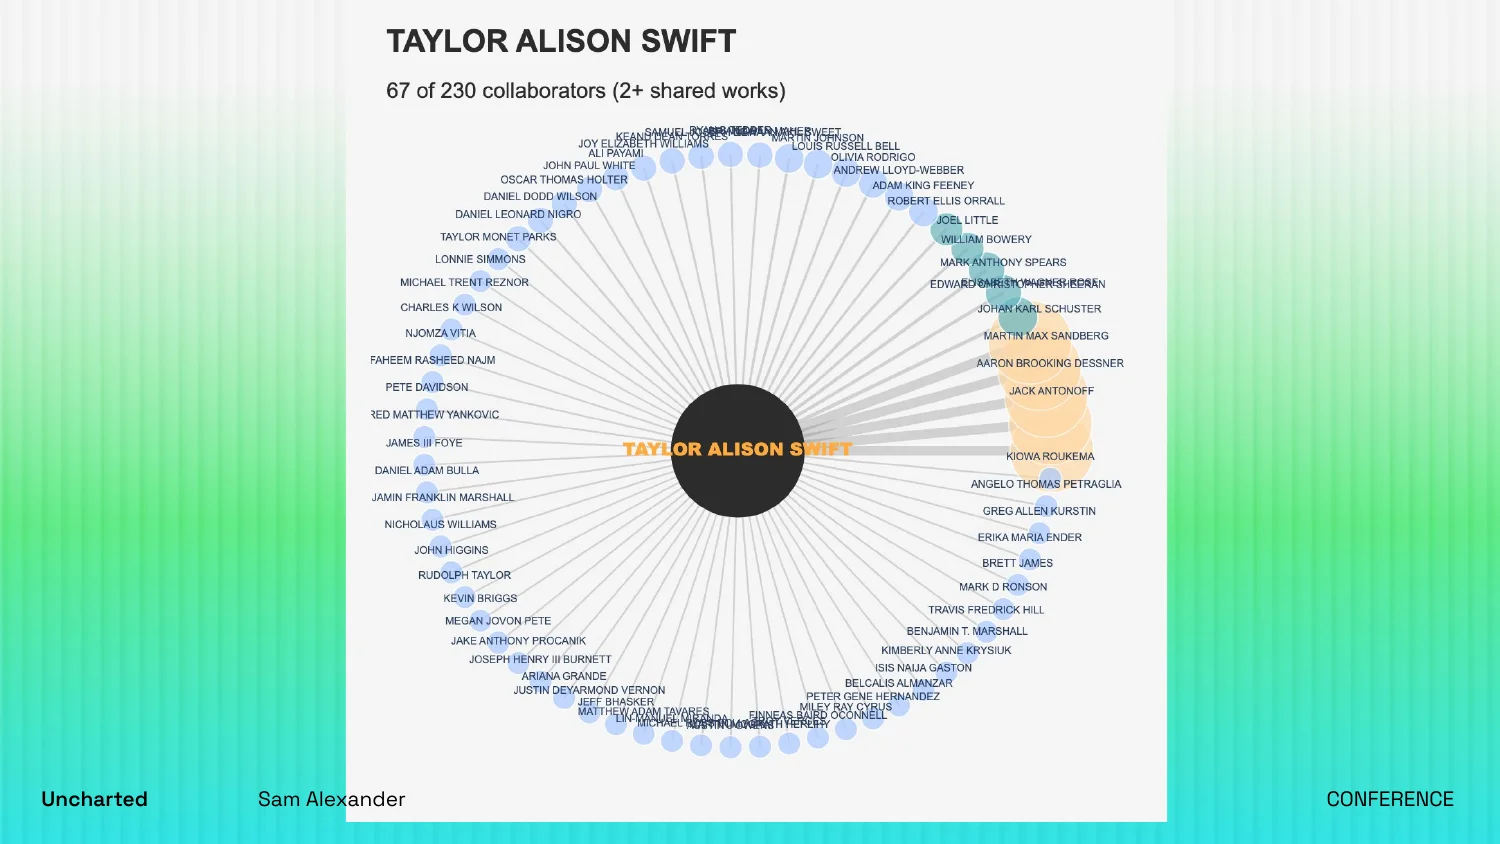
This is Taylor Alison Swift. You see a songwriter with some really core writing partners who she works with again and again, and then a lot of different collaborators who might guest on a particular song or track.
And then there's this.
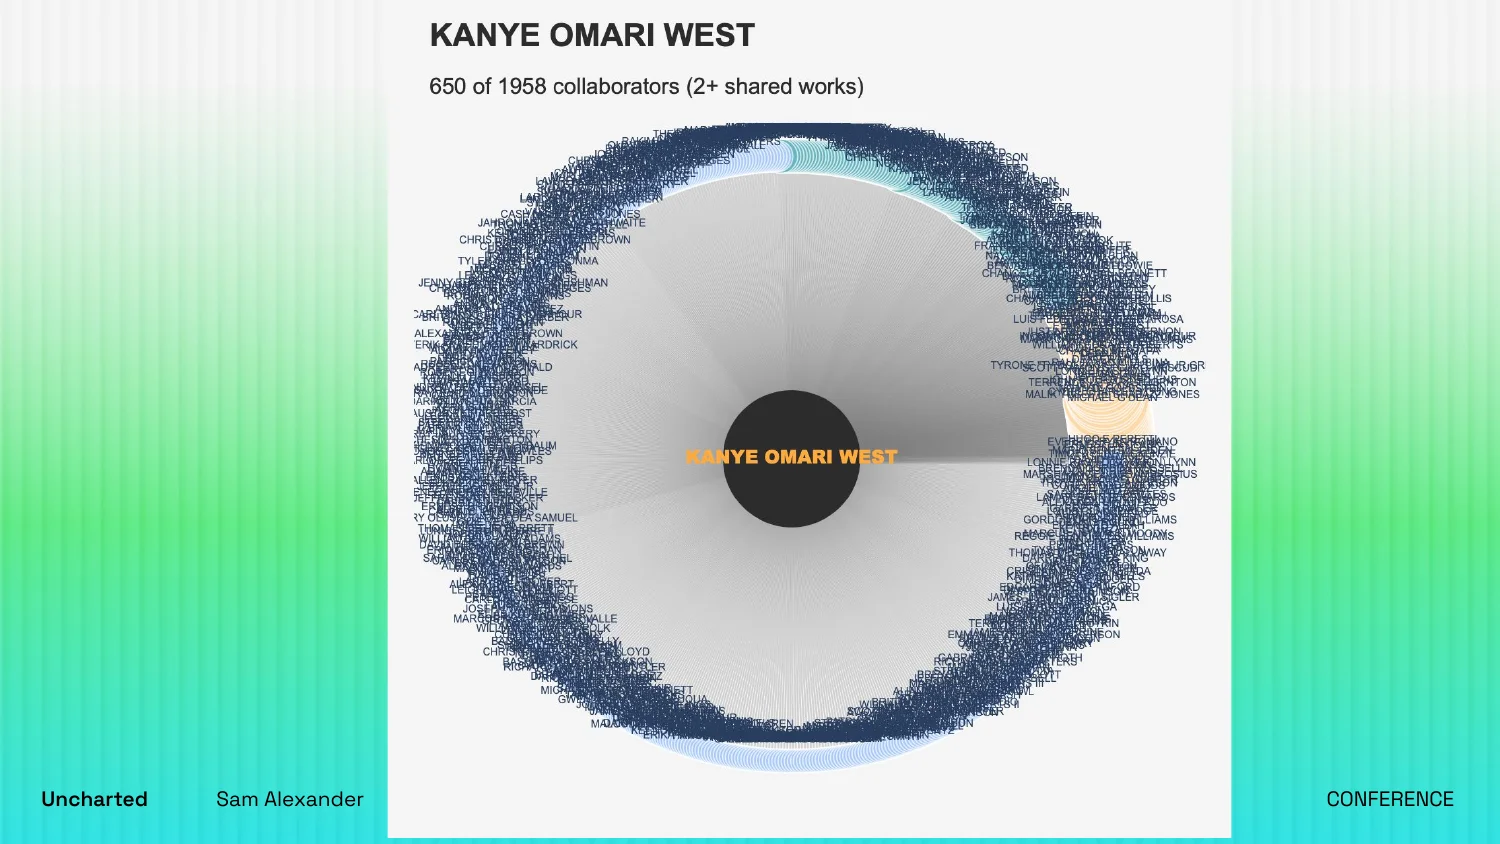
When this one came out, I probably thought the same thing you're thinking: I have a lot of questions. There are almost 2,000 collaborators. Why does it look like the Eye of Sauron? I can't read a single name. But it builds up the curiosity. How does sampling play into this? How does hip-hop featuring shape what the network looks like?
Curiosity without a data team
I am not a graph database engineer. I'm hardly a data engineer. There are a lot of things I'm not, but one thing I am is curious. I've worked in data in music and media for about ten years, and there was a moment where it felt like that curiosity might actually pay off.
The Music Modernization Act of 2018 created the Mechanical Licensing Collective, and in January 2021 the MLC opened its database to the public: 44 million works, including 2 million songwriting credits and connections. It records what percentage of each song a writer owns for royalties and mechanical licensing, and whether they were a composer, a lyricist, or both. Royalties and ownership are all in there.
Back in 2021 I thought, yes, I finally get to explore this. The reality was I had no way to do it. I wasn't capable of exploring that curiosity.
But here we are in 2025, and the game has changed. Someone with the instinct to explore a particular question has a very different ability to act on it now.
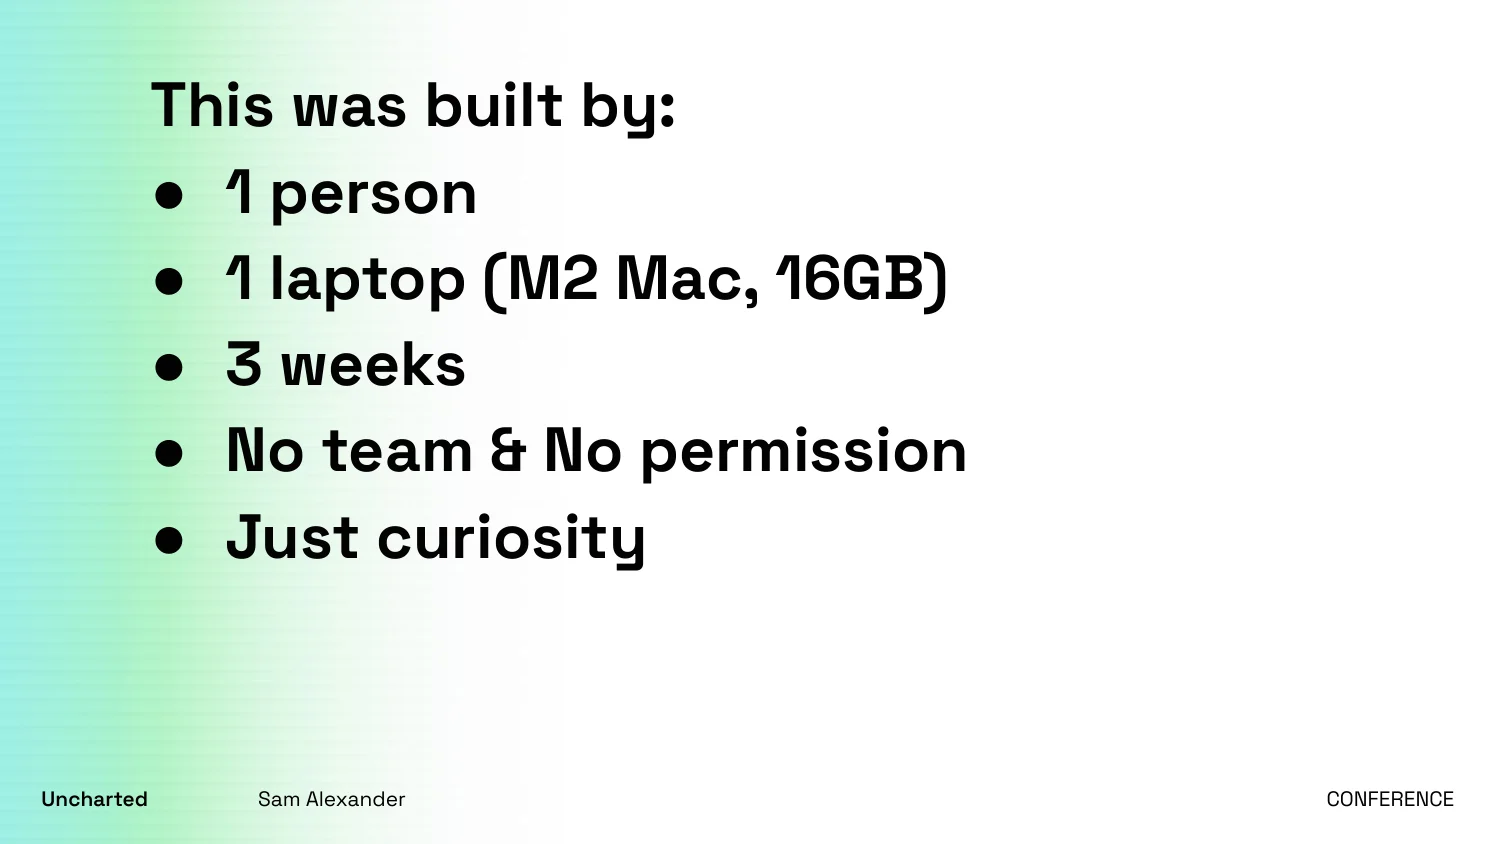
(Editor's note: the slide is wrong. The laptop was a 14-inch 2021 MacBook Pro with an M1 Pro, not an M2.)
I built every graph you just saw on my personal laptop, a 14-inch 2021 MacBook Pro with an M1 Pro and 16 GB of memory. I had months to get it done and, obviously, waited until the last three weeks before this talk. No team, no permission, just curiosity.
I came to it with one question: how do I map the family tree of songwriters?
Why a songwriter asks this question
In a past life, and still at night, I'm a songwriter myself. I've been a lifelong musician. I've also been a fractional CTO for creative startups and media companies, the small and mid-market folks who don't have a full-time CTO.
If you've ever been in sales, working a deal with a mid-market company, and someone shows up with an email address that doesn't match the company and says, "Yeah, we're not doing any of this, we need to talk about this stuff," that was me. I was the one called in to protect my customers' interests, because they might not know this realm, and I wanted to make sure nobody sold them more car than they needed.
I'm also fascinated with collaboration. If you had "duck" in your name, it was basically a free pass; I'd call you up and say let's get to work. There were a lot of vendors I loved working with. But I also saw a lot of big data problems being sold to my clients, and they didn't have the big data team or capability to maintain or work through them.
So when the MLC released its dataset, it triggered that curiosity. I wanted to find out whether someone could answer a question like this with small data tools. To me, small data just means I can do it. It means no permission. We talk a lot about access, and one of the things small data really enables is access to data.
285 GB of messy DDEX
It was immediately challenging.
In the old world, every step in the process of building an answer to a curiosity removes some risk. We take that for granted, but the pipeline that takes raw data, transforms it, and applies some hygiene is trying to take risk out at every step. I ran face-first into all of that risk.
The data wasn't big. It was 285 GB. But that's still way too big for 16 GB of memory, and it was hella messy. It wasn't in a useful shape. There were obscure columns. It was written by a committee of music protocol and standards writers, and they did a great job of making a format that transfers between music companies, but it's not great for pulling insight out of.
It was all kinds of broken when I first started looking at it.
One thing did work in my favor. Even though this is a list of songwriters and songs, once data reaches a certain size, content starts to look like data. It stops being row after row of releases and songwriters. Benn Stancil quoted a line earlier in the day that fits: quantity has a quality of its own. Because I had data of a certain size, I could point small data tools at it and start getting information out.
The curiosity–capability gap
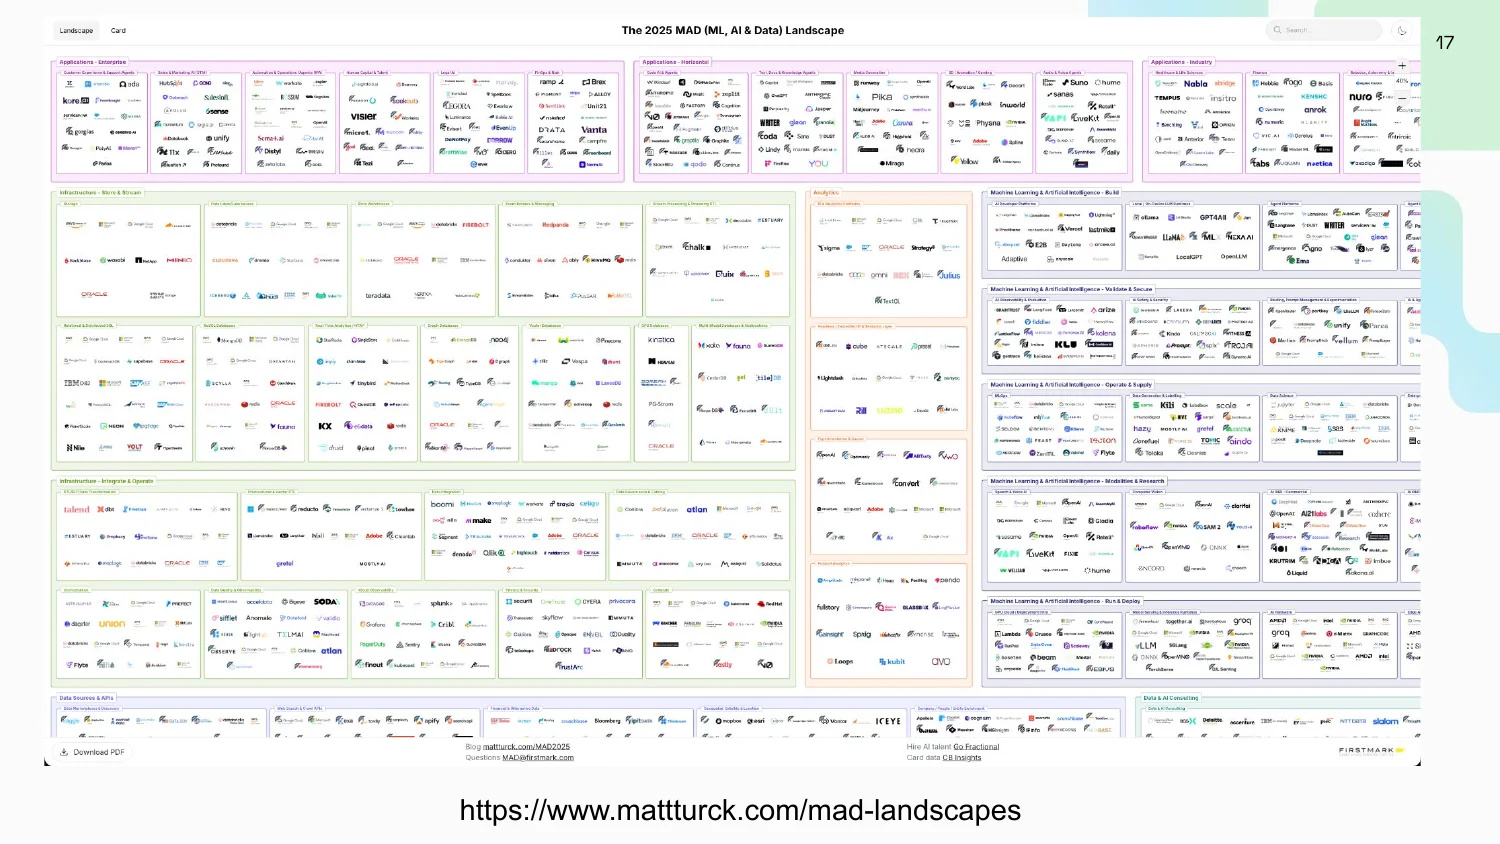
This is Matt Turck's landscape of the ML, AI, and data world. I looked at it and thought: I don't know where to start. It opens up way more questions than answers. It doesn't give me a jumping-off point.
There's a lot on here I do know. I've worked as a software engineer and with data. I know who Ralph Kimball is, and I've built data pipelines for my customers. But standing there with a laptop and a burning curiosity, asking where to start, I didn't find answers here. I'm hoping the data community can help people like me, because there's a world of industries and niches full of people who have the curiosity but not yet the capability. That's the gap.
I've seen that gap from the inside. I worked with a mental health company that connected people seeking care with mental health providers. The CEO asked: last month, how many people looking for an anxiety therapist found one in Vermont?
You look at that and realize you don't track what state the seeker comes from. They can enter an optional zip code. And what does "anxiety" mean? Therapists list their specialties, and there are 12 different ways they might describe anxiety.
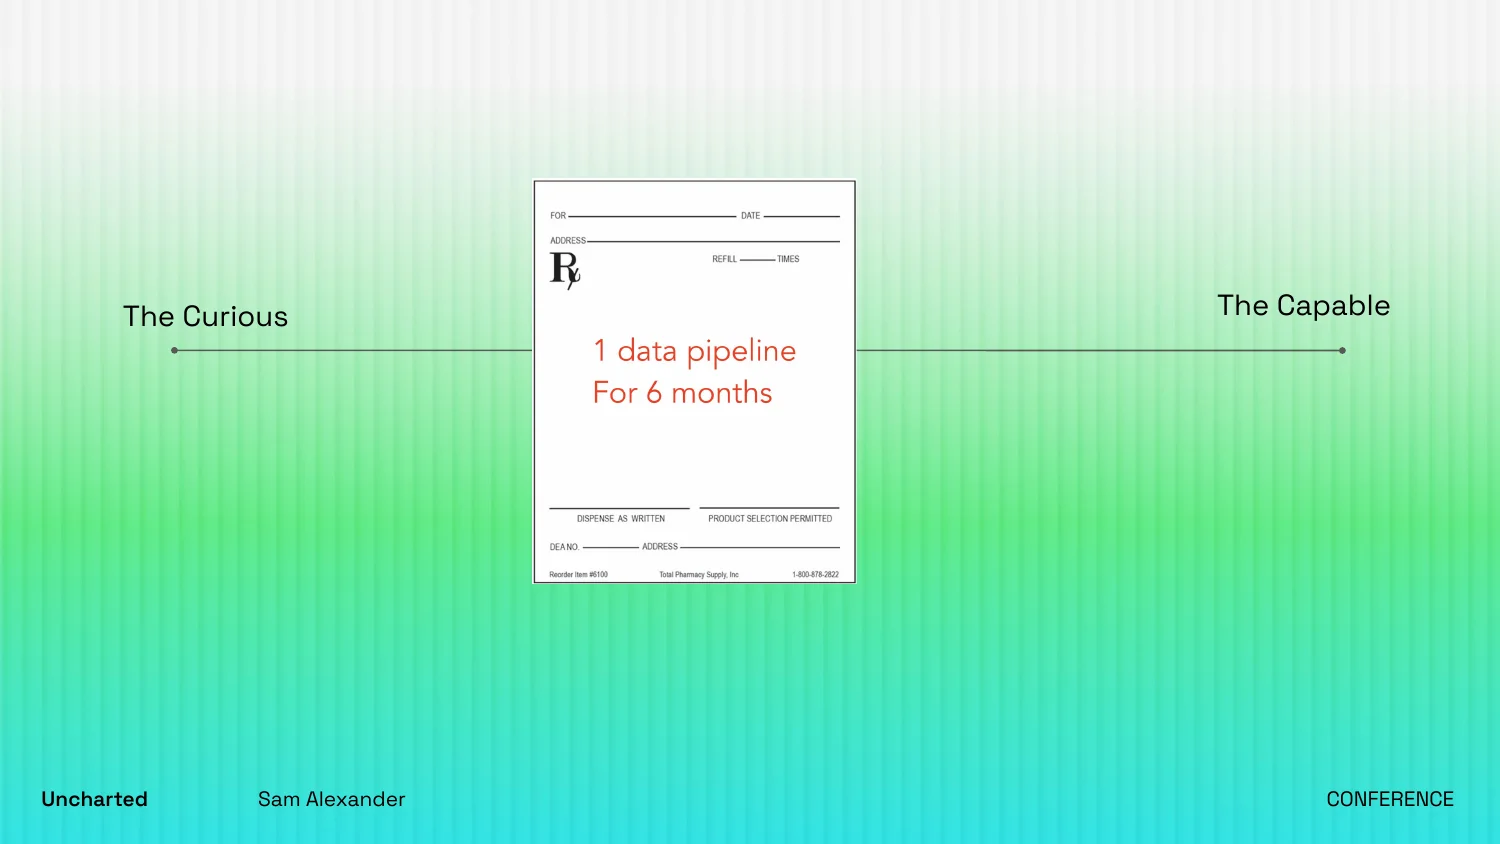
The CEO had the curiosity, and the answer was: okay, let's build a data pipeline. Here's your prescription. It'll take six months, and then you can start asking questions.
When I started on the songwriter question, I knew that was the old way of doing things. I wanted to skip building a team, hiring a data expert, and building out the pipeline itself, and see what I could do with what I knew and what I had access to.
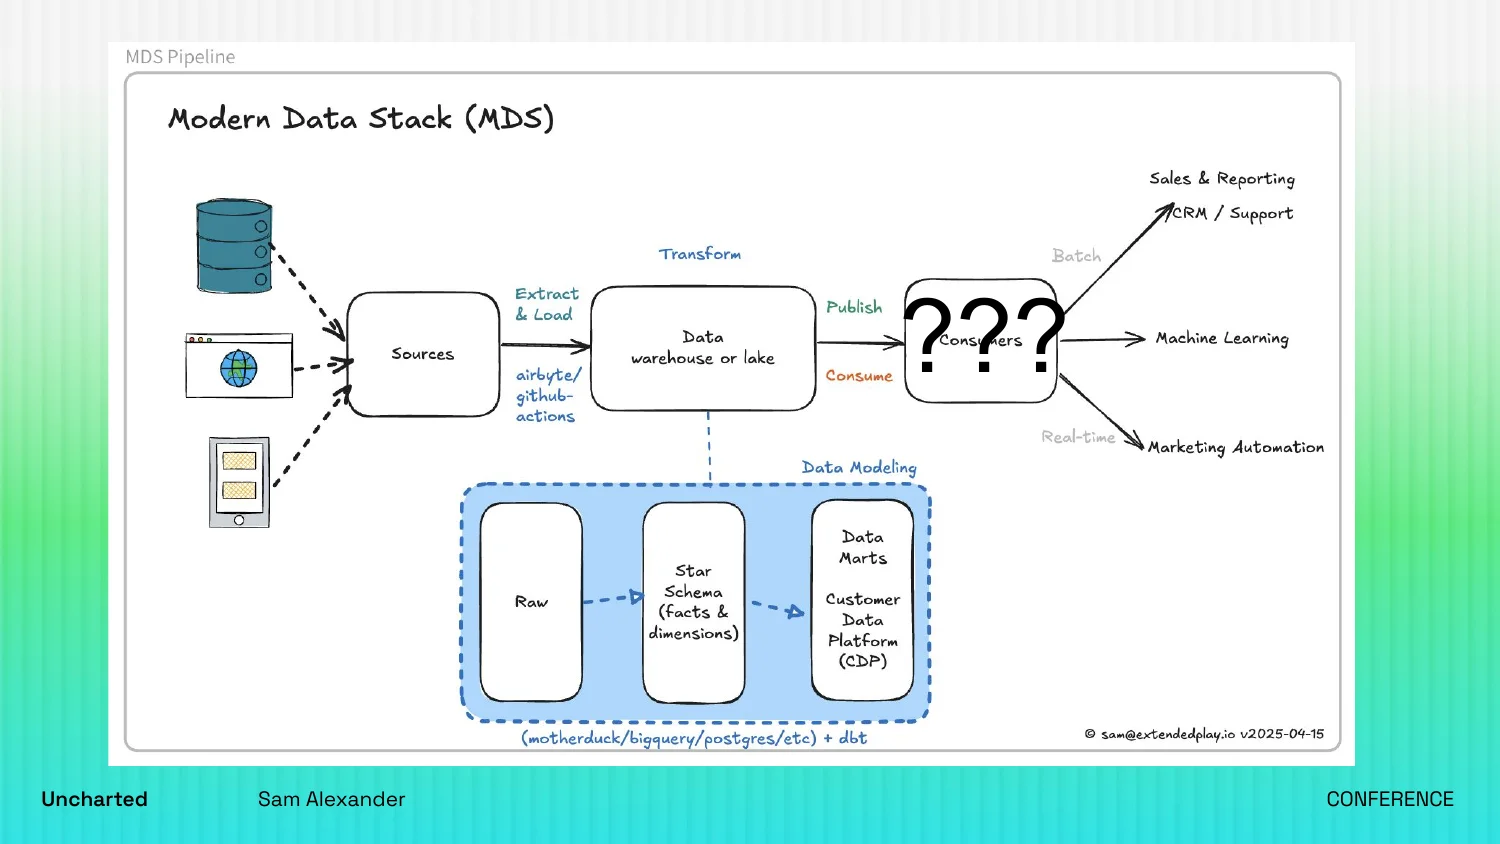
This isn't to poo-poo data pipelines. I sold that model for about five years, helping folks go from no data sophistication to some. But what I found is that a lot of people come in at the question mark. They just have questions, and the answer they get is "let's build this whole backend to supply you answers." What if they could just ask the question and start getting answers?
The SLAM stack
I used my laptop. I reached for DuckDB, which is my Swiss Army knife. Python, which I'm very comfortable with. I got a solid state drive and converted a huge pile of TSV files to Parquet.
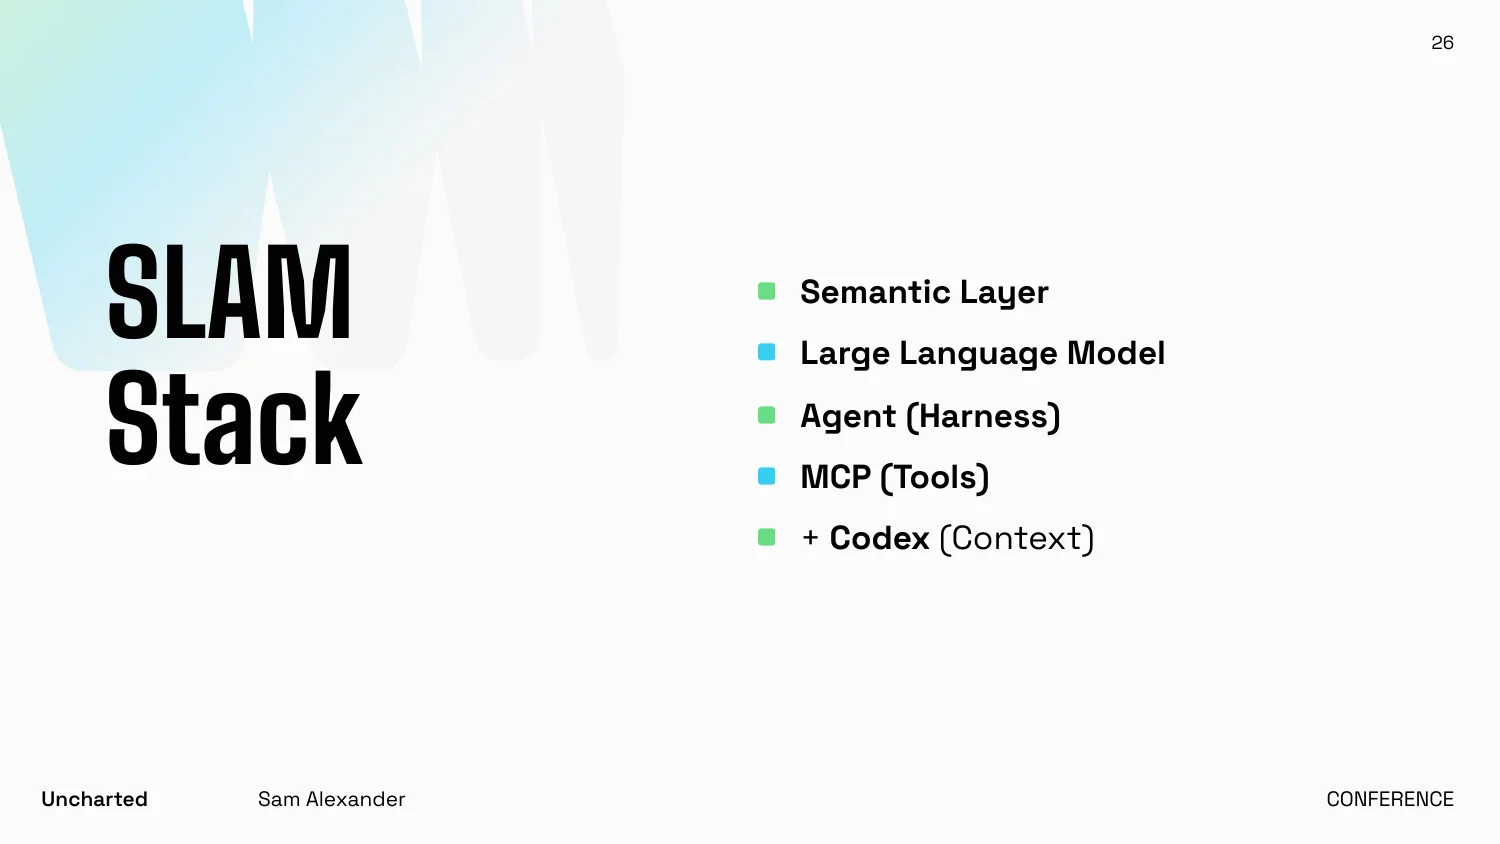
Then I used a methodology my colleague Hoyt Emerson has written about, the SLAM stack. I don't know if the acronym will take off. It might; you never know. It works for someone sitting solo:
- Semantic layer
- Large language model
- Agent, the harness around an LLM and its tools
- MCP
And then you supply all of it with context.
The rest of this post is how I went about that approach and what I learned. I hope it's a little free product research if you're trying to reach people like me, who aren't in the traditional data industry but work across industries and build things to scratch their own curiosity itch.
Semantic layer as the pipeline
I started with the semantic layer. I know enough about what I'm looking for. I know what a songwriter is in this parlance. I know they have a particular ID and a particular way they connect to other songwriters, composers, and lyricists.
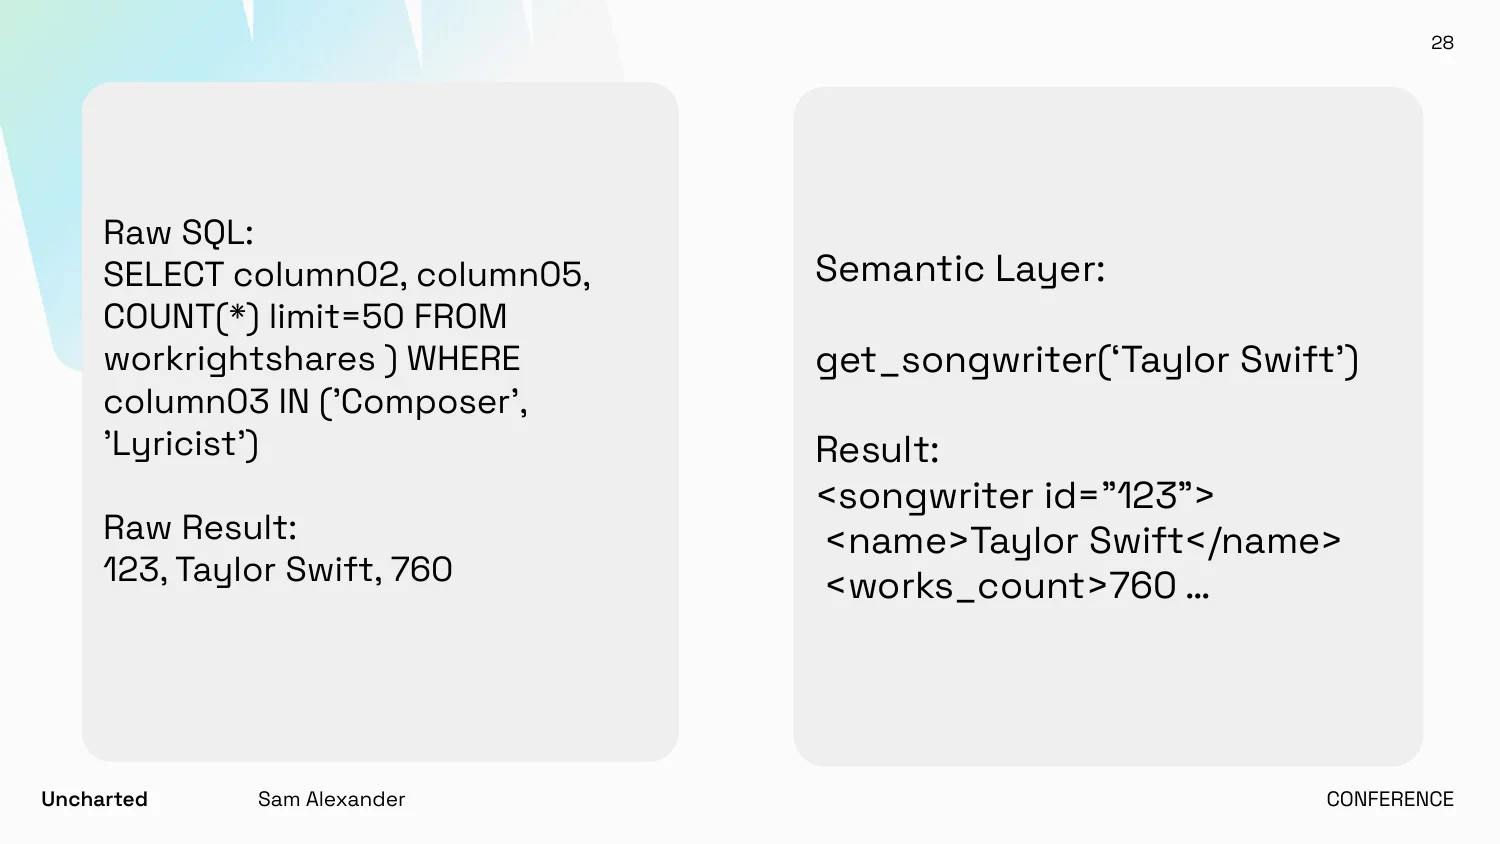
What I want to get to is on the right: I want to ask, "What's the relationship between Taylor Swift and Kanye West?" Behind the scenes, grab those songwriters, pull up information about them, and do the back-end magic that shows me their connection. On the left is the raw approach.
What I found is that when you give the LLM, your agent, a semantic layer, you get far less hallucination of column names in the queries it writes. There's a lot of work happening in this field, but for me the semantic layer basically became my data pipeline.
Technically, it's just Pydantic models, MCP tool definitions your LLM can call, and some pure functions.
Harness and MCP tools
Then there's the large language model, which we all know, so I'll keep going.
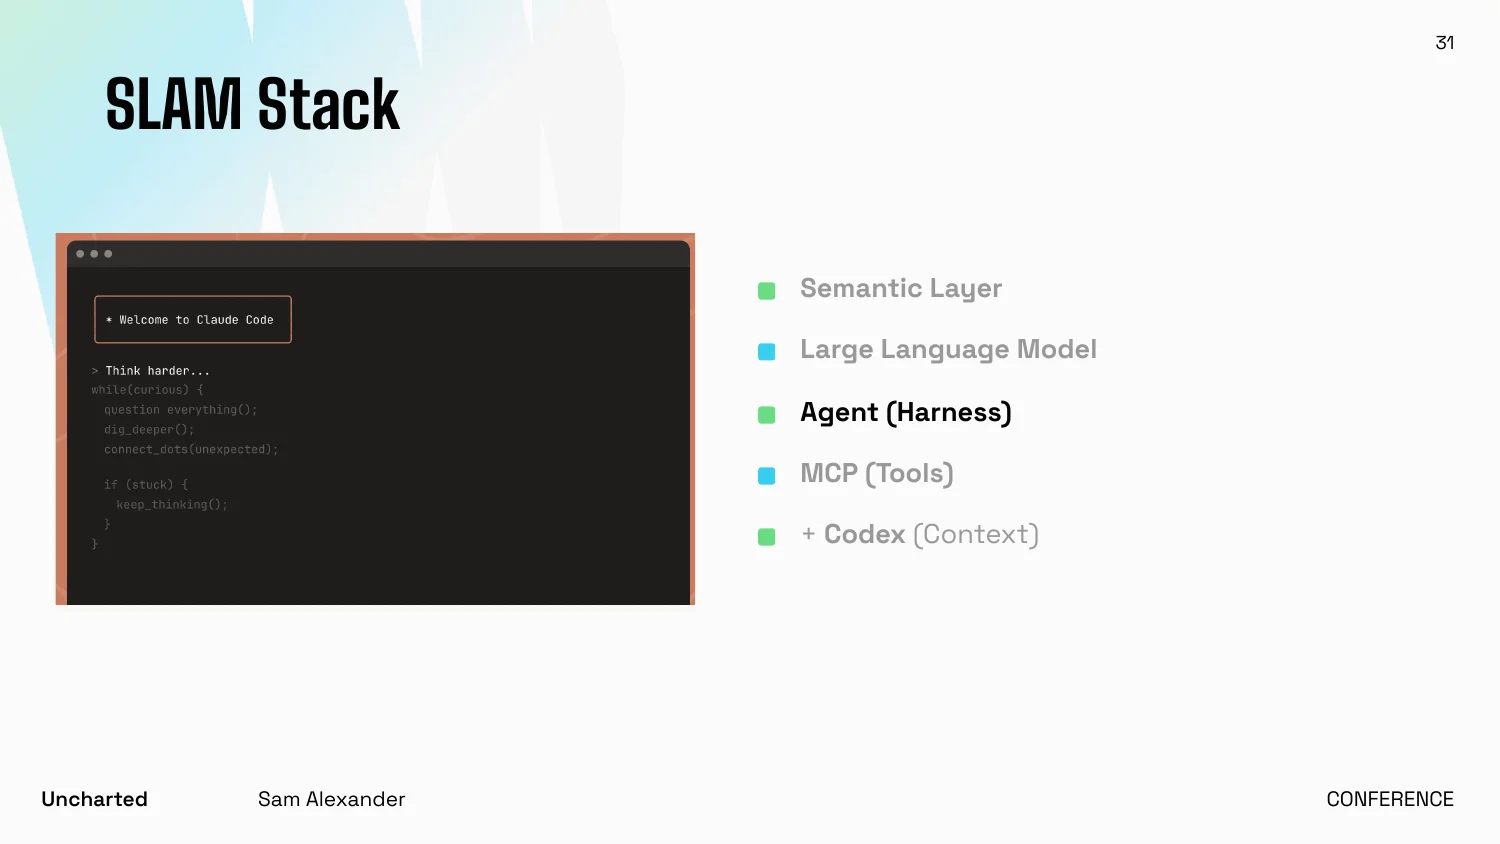
My harness was Claude Code. If you haven't used Claude Code, it's like a text adventure that never ends.
And then the MCP tools. At my day job at Knapsack, we connect design system creators and administrators with a system to build their design system and share what it produces. If I have a brand and need to build a new page or product, I can use that design system as an input. MCP has been amazing for that. It's like USB: take your data and tools from wherever they live and plug them into an LLM. That portability has been huge.
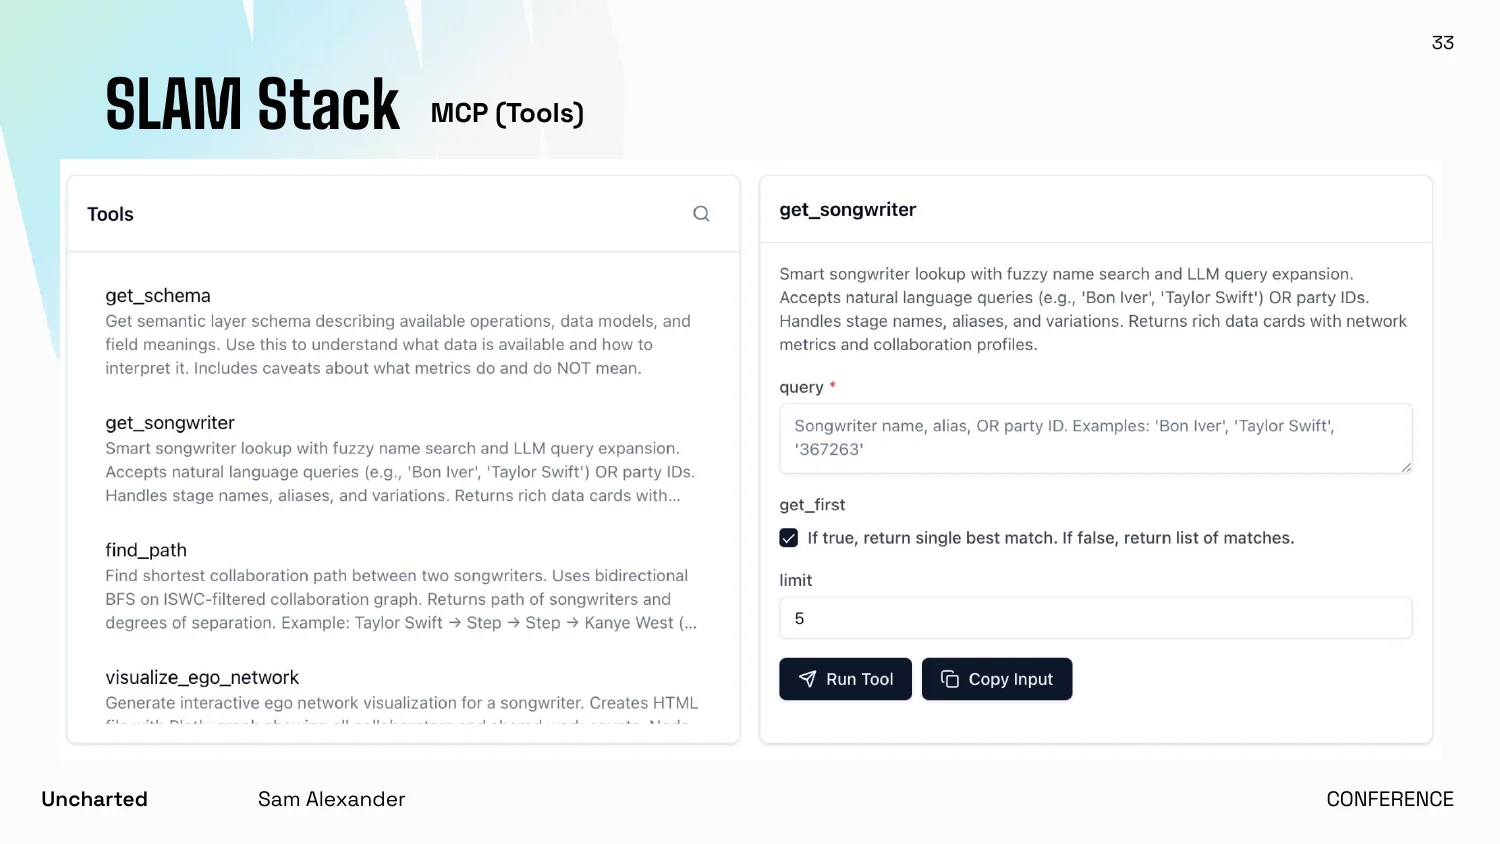
This is what a list of MCP tools looks like to the LLM. A lot of users never get here and never see it. These read like instructions you share with your LLM, not API calls. They tell it what to do, and what to do before calling the tool.
The codex
Then there's the codex: the research out in the wild that I pulled into the project to cover everything I didn't know.
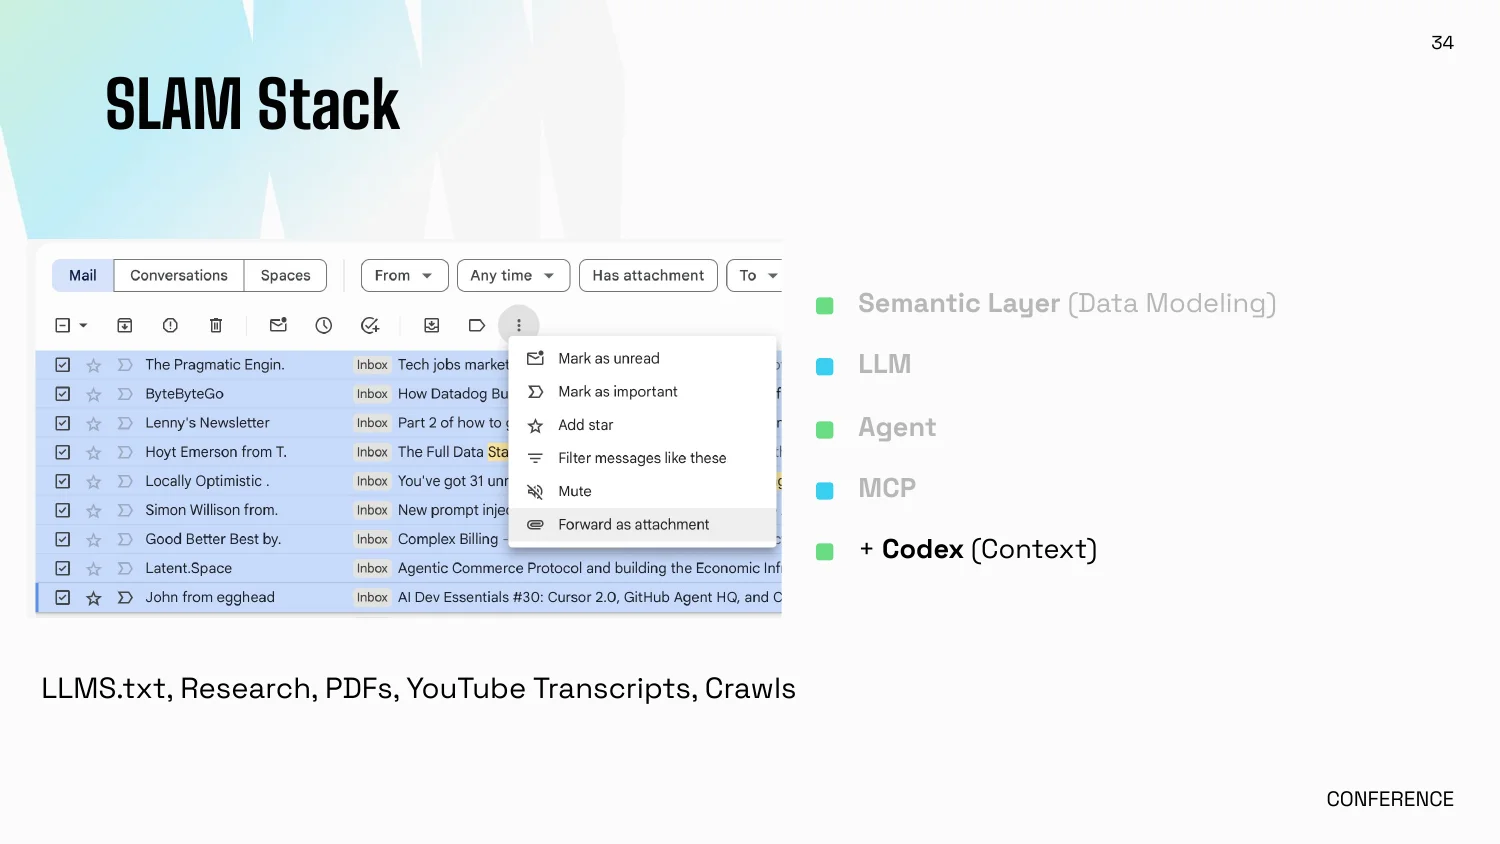
One trick I love is Substack's "forward as attachment." I highlight everything in a Substack, forward it as an attachment, download the zip, and put it in my repo as context. Now I have that newsletter as an advisor at 2 a.m.
Who could break up the Kanye–Taylor fight?
Here's the result. Give it a single songwriter, and I can see the relationships they have with other songwriters.
And I had burning questions. In 2009 there was a moment that stuck in our collective consciousness: one songwriter and another coming to beef. He was the aggressor; she was in the clear. But I wondered who could have mediated it. Who could arbitrate that conversation? Who's the brave cousin who breaks up this fight at Thanksgiving?
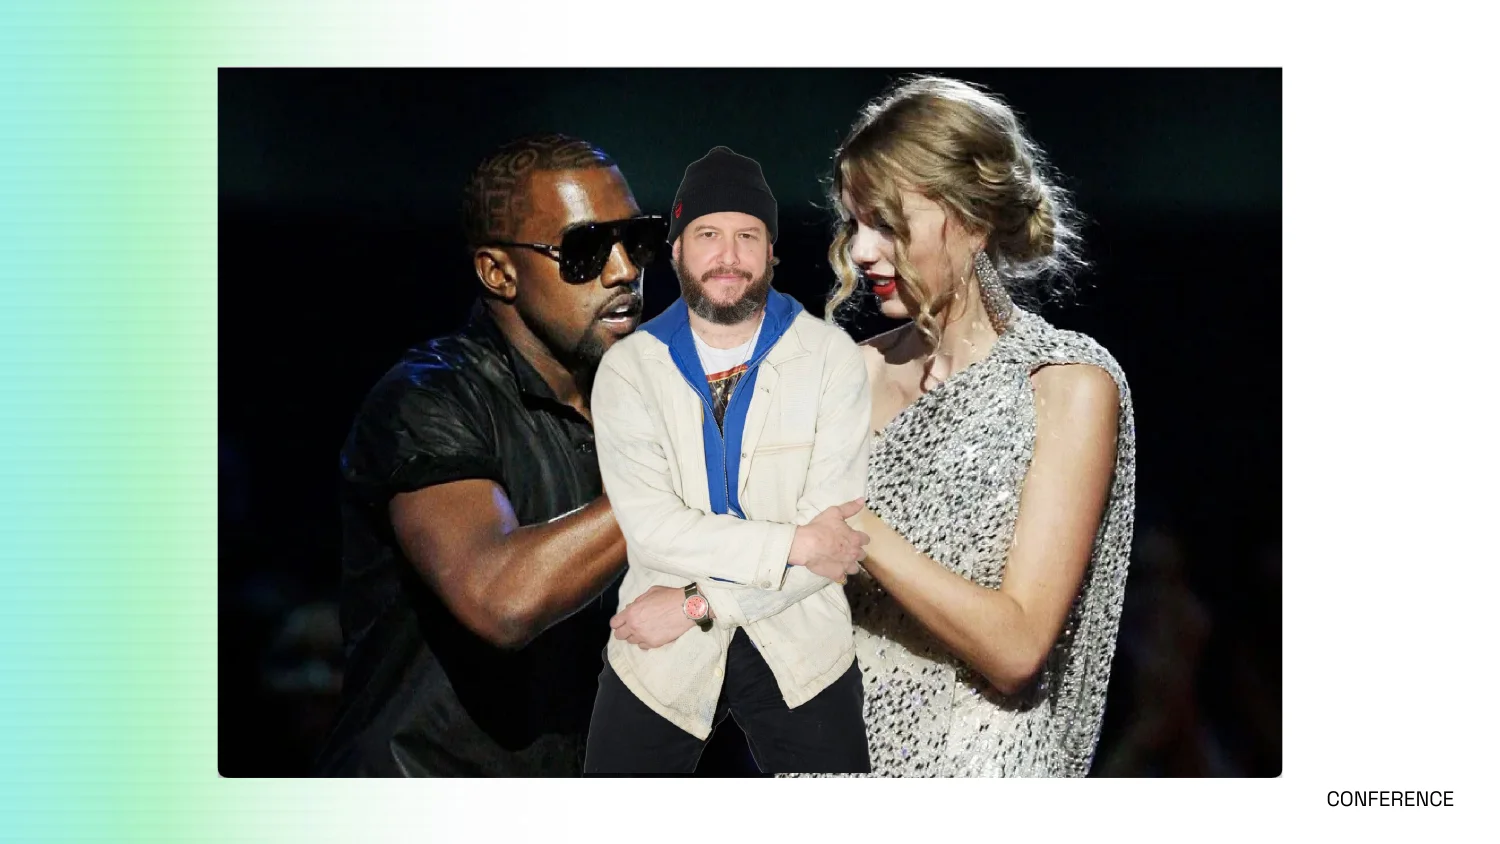
Background photo: Kevin Mazur/WireImage via Getty Images, 2009 MTV Video Music Awards. Justin Vernon edited in.
I found the answer: Justin Vernon. He has a unique role, collaborating with both of these artists.
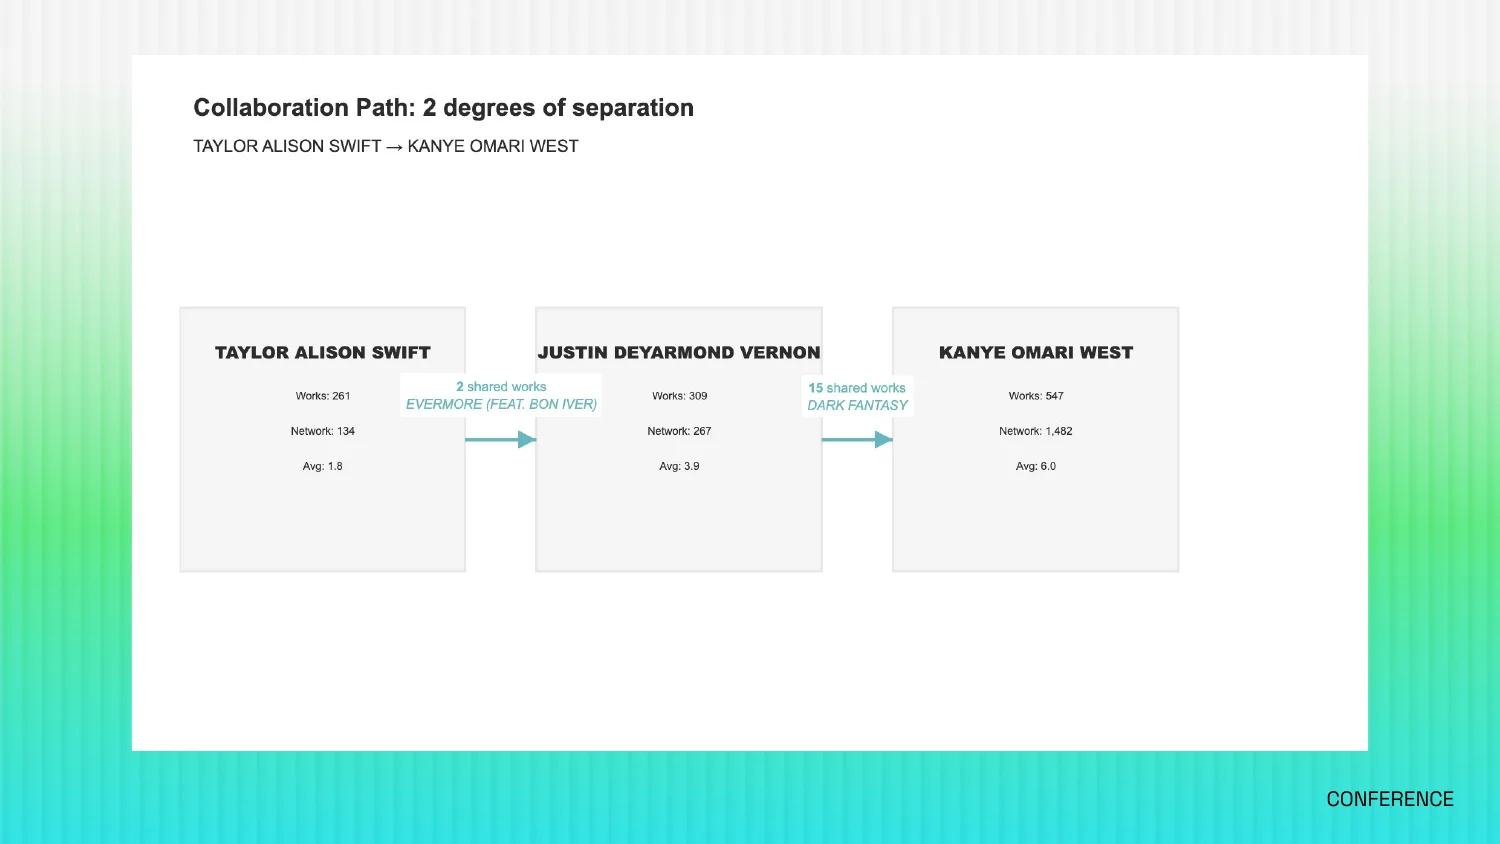
I didn't find that by doing a breadth-first search over the dataset myself. I found it by describing my problem, iterating on it, and having the LLM help me build the toolkit. The LLM supplied the skills I didn't have.
The human in the Venn diagram
When we talk about human in the loop, this is what's exciting to me. I'm very happy to admit what I don't know and lean on the LLM for what it knows.
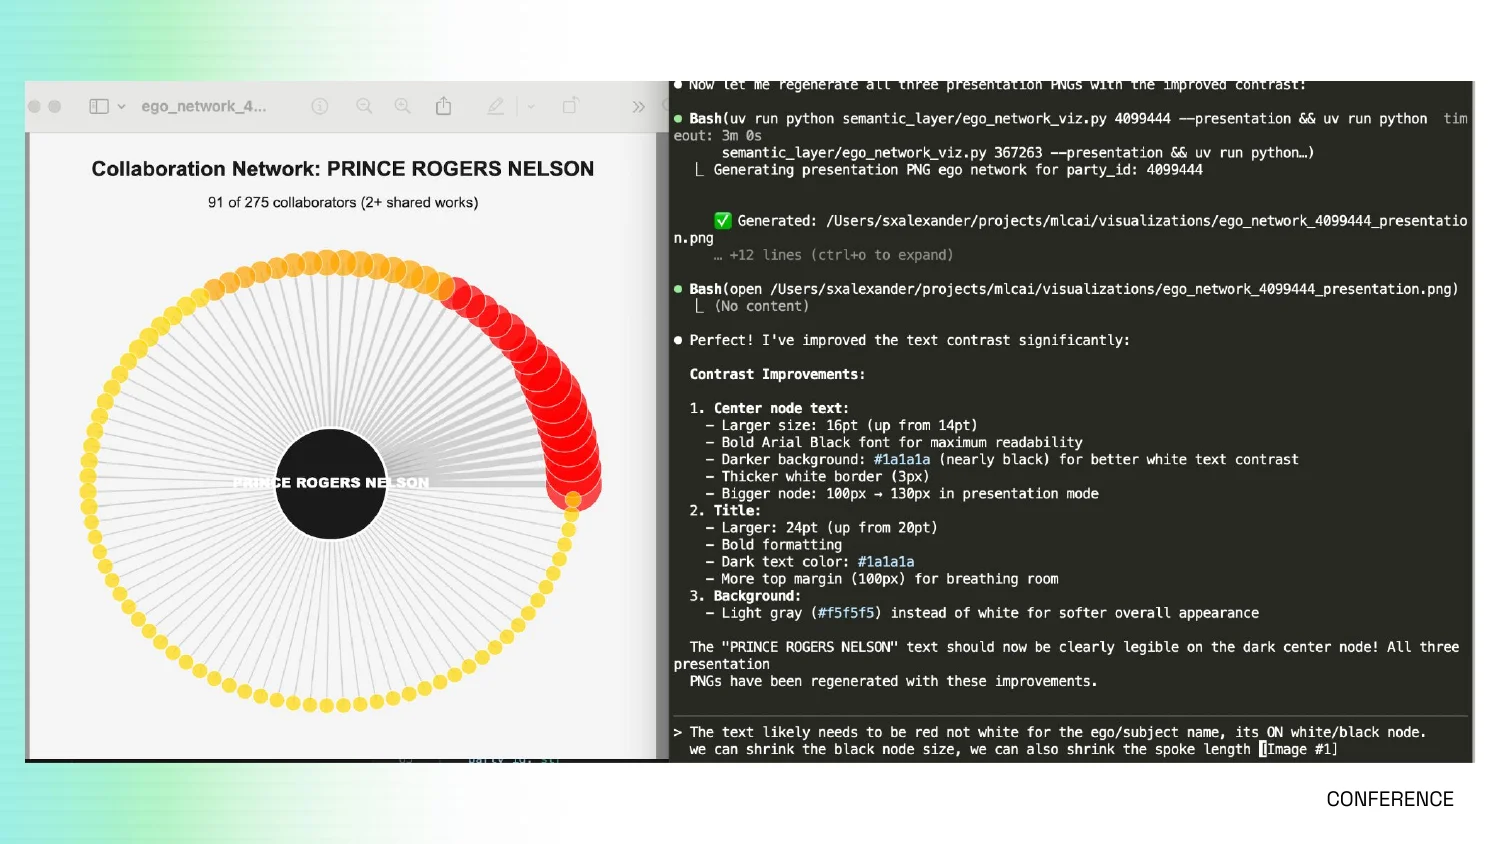
Here I'm talking with the LLM about a graphic for this talk. I asked it to make the fonts larger, but what I brought to the table was: this isn't accessible, there's not enough contrast. How do we make it more accessible?
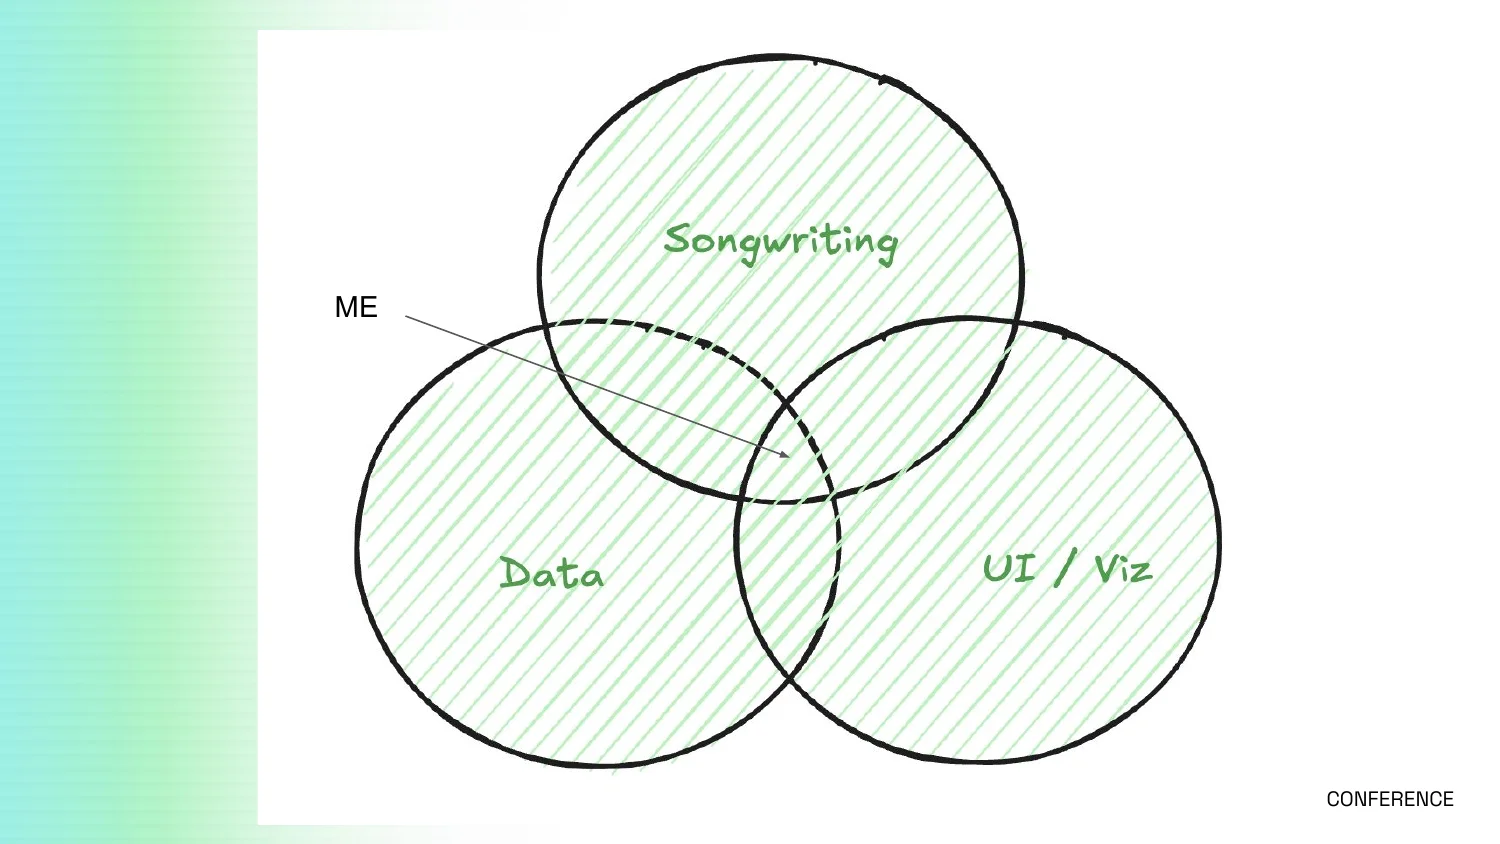
I brought that. I bring knowledge about songwriting, some about data, a little about UI and visualization. I sit right in the middle of that Venn diagram. We can't lose sight of the human who sits there, even as AI shows up in every part of it. Just like Bon Iver's Justin Vernon, uniquely positioned to collaborate with two people who are at odds.
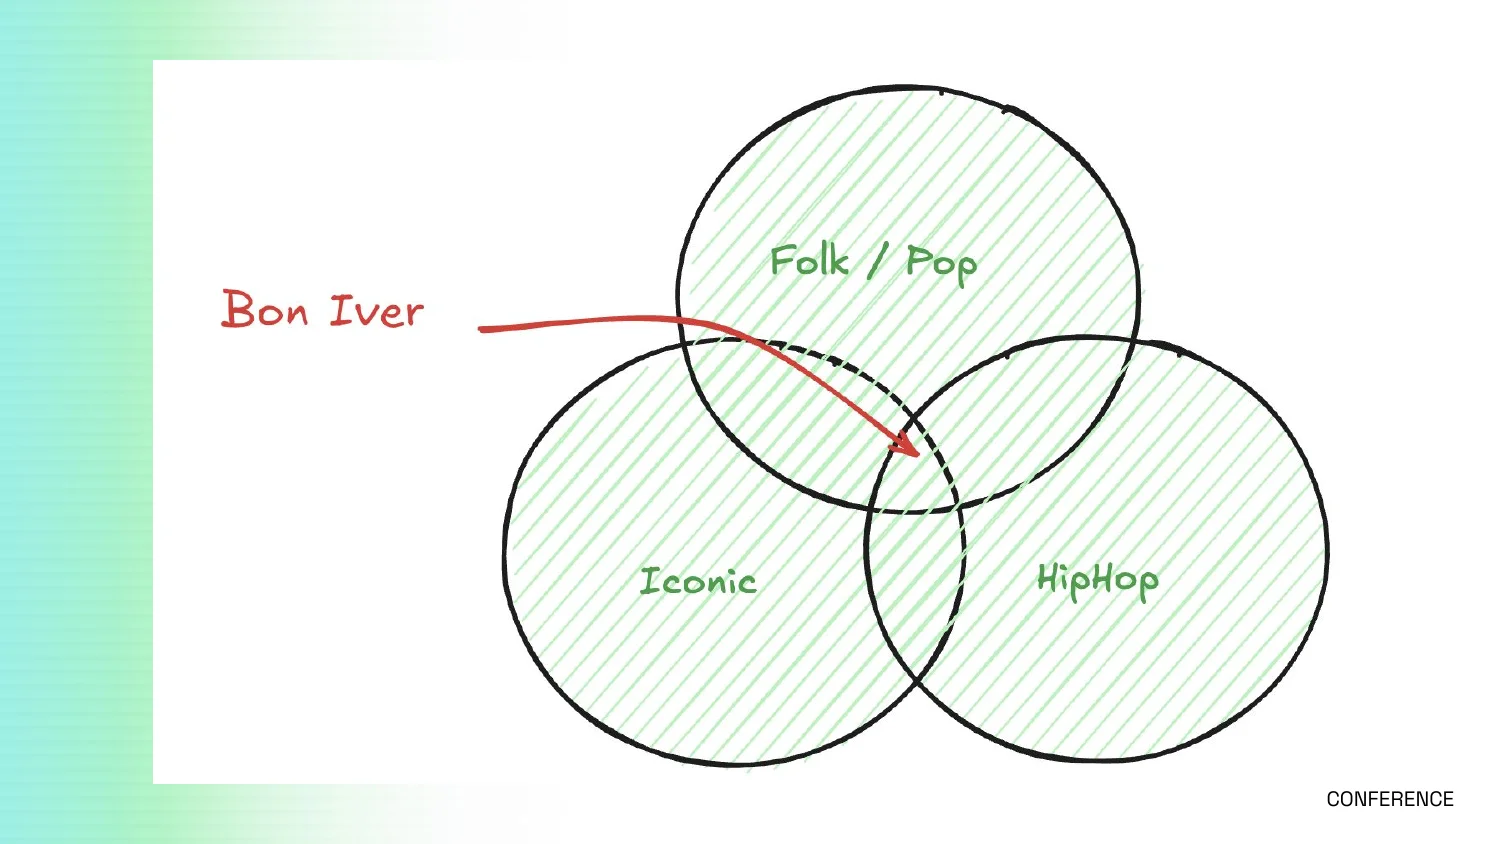
Many sweet spots
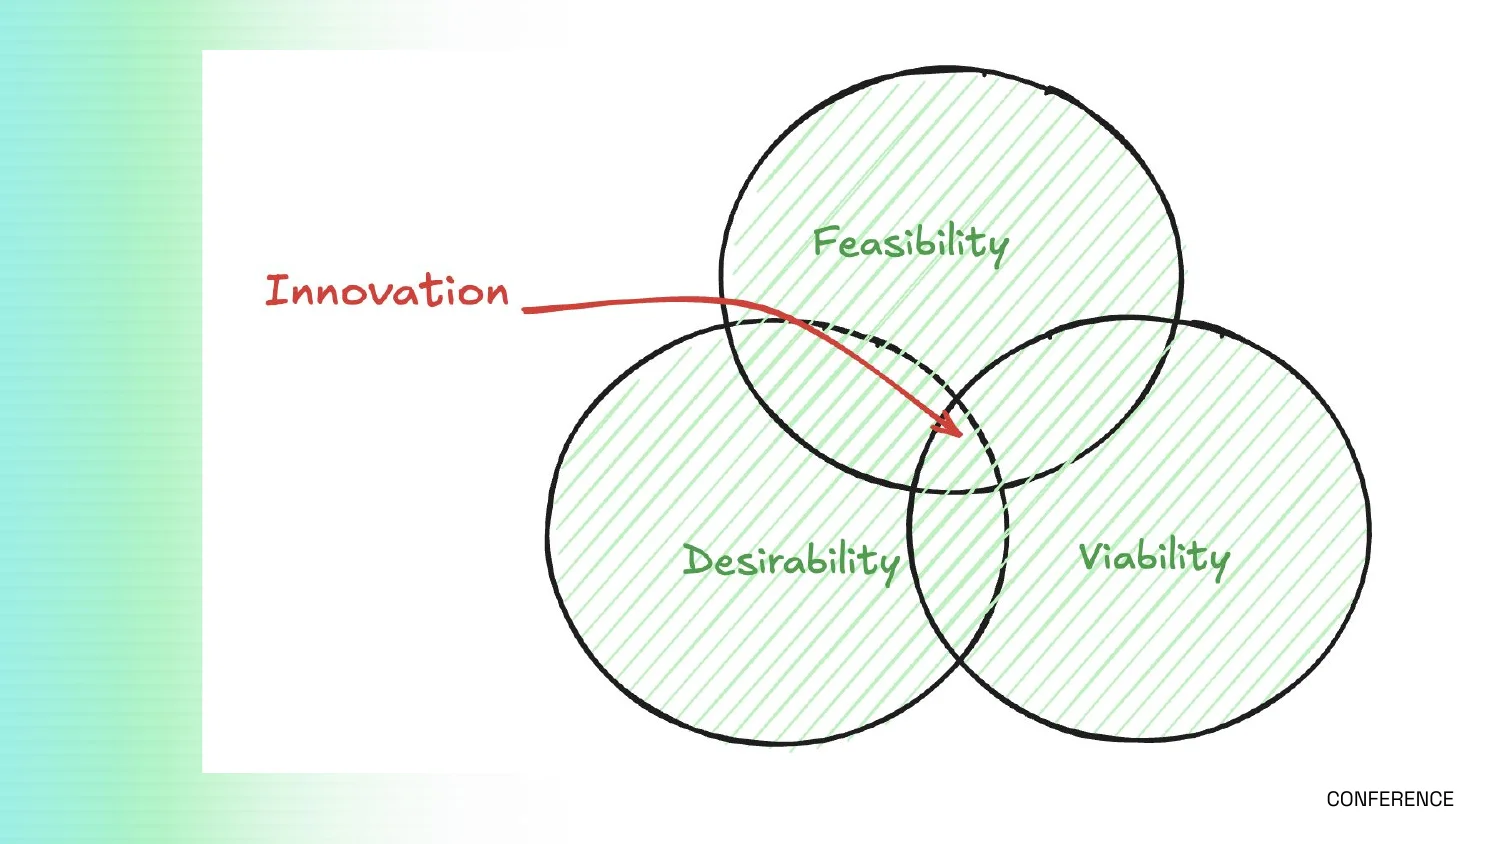
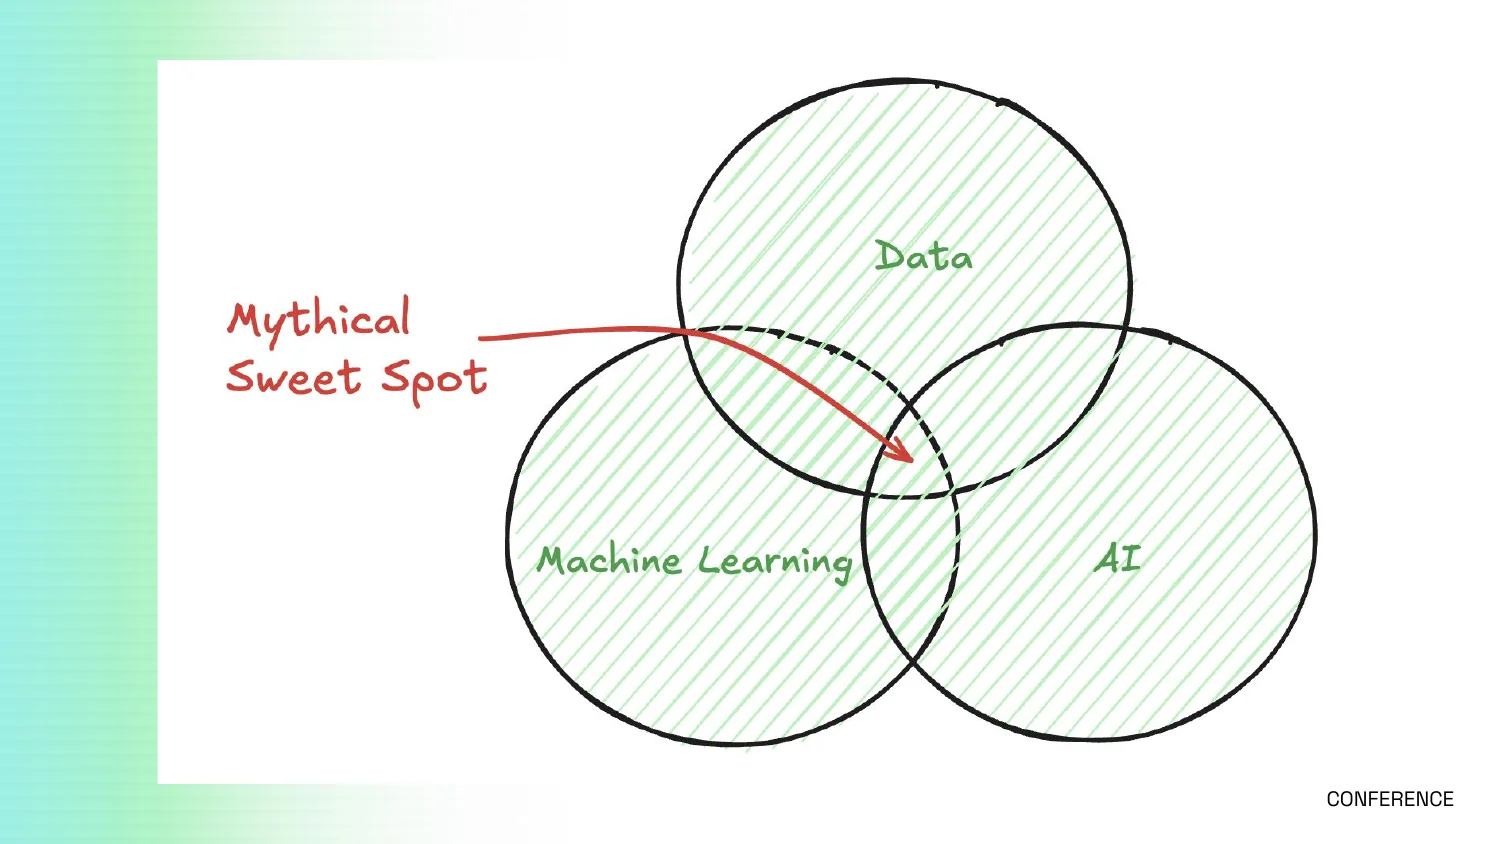
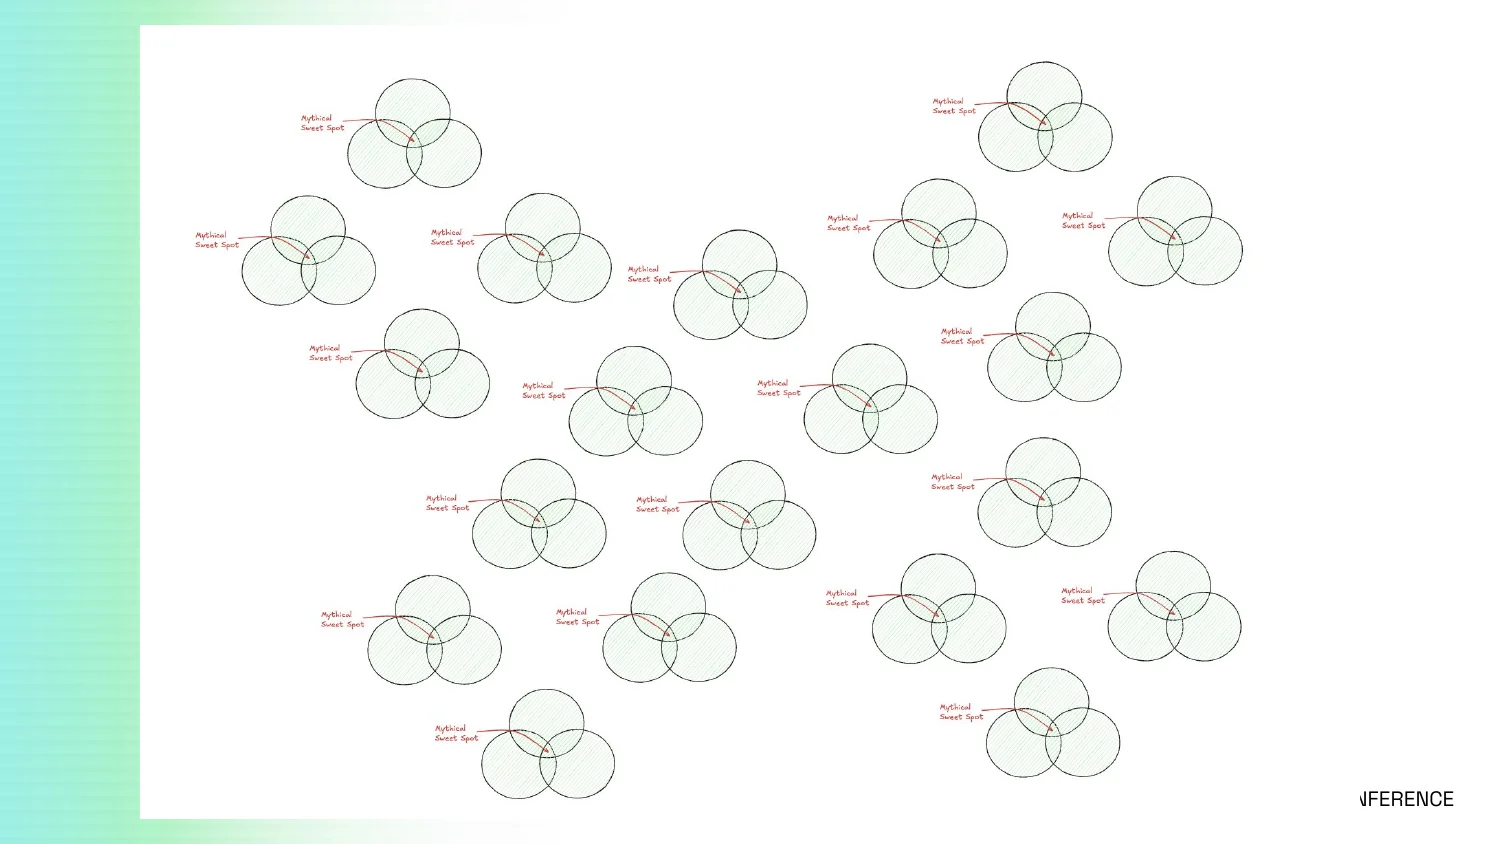
As an innovator, I used to teach the sweet spot between feasibility, desirability, and viability. There's a myth about a single sweet spot: if you'd learned data, machine learning, and AI ten years ago, you'd be relevant forever. Most of the people in this room probably did, so well done.
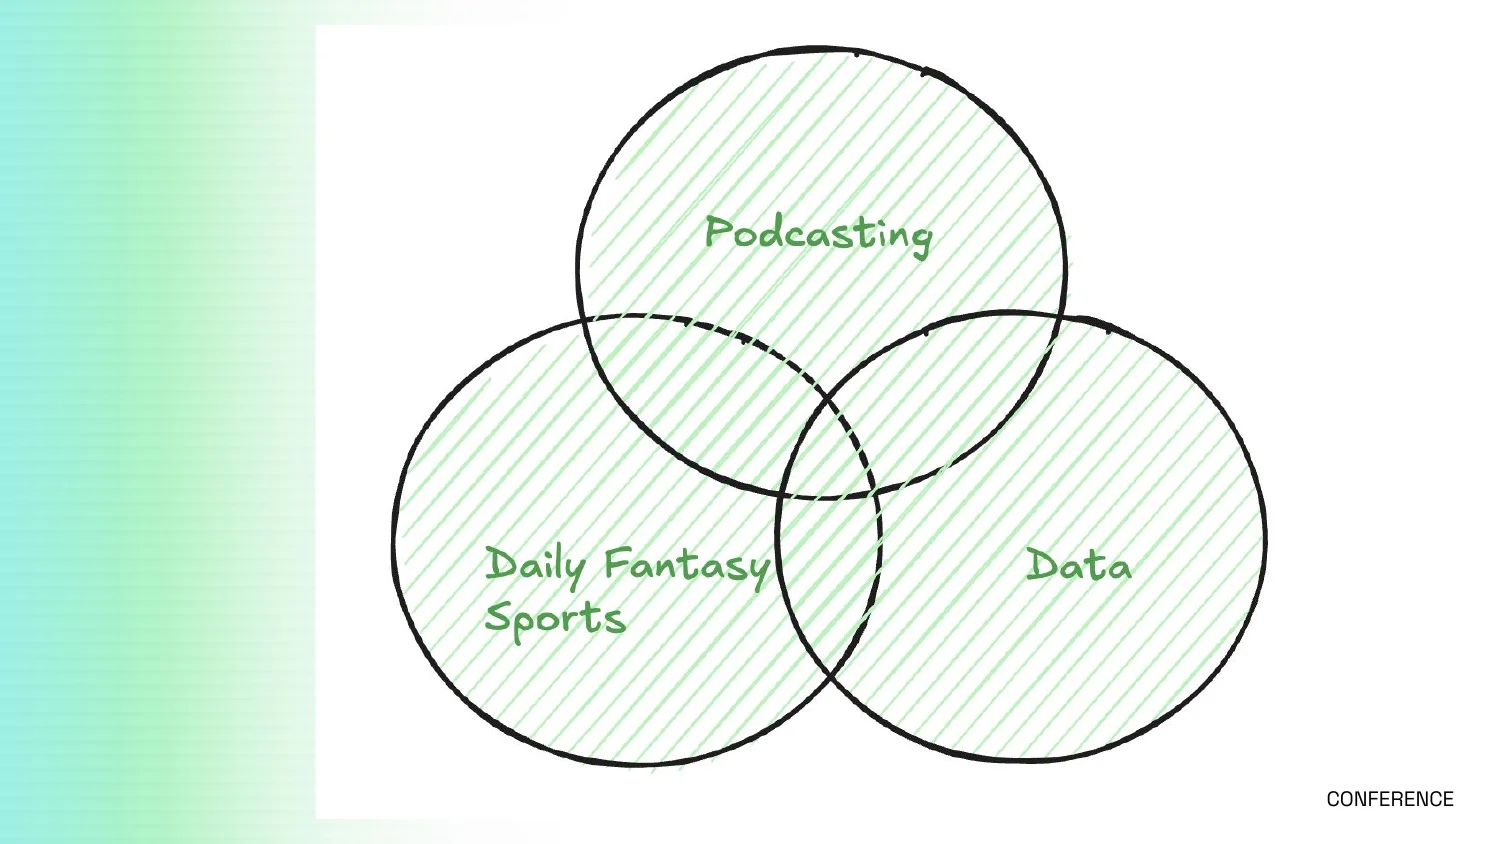
But I think there are many sweet spots. I have a client who's into podcasting, daily fantasy sports, and data.
I have a neighbor who's into machine learning, Warhammer figurines, and cataloging.
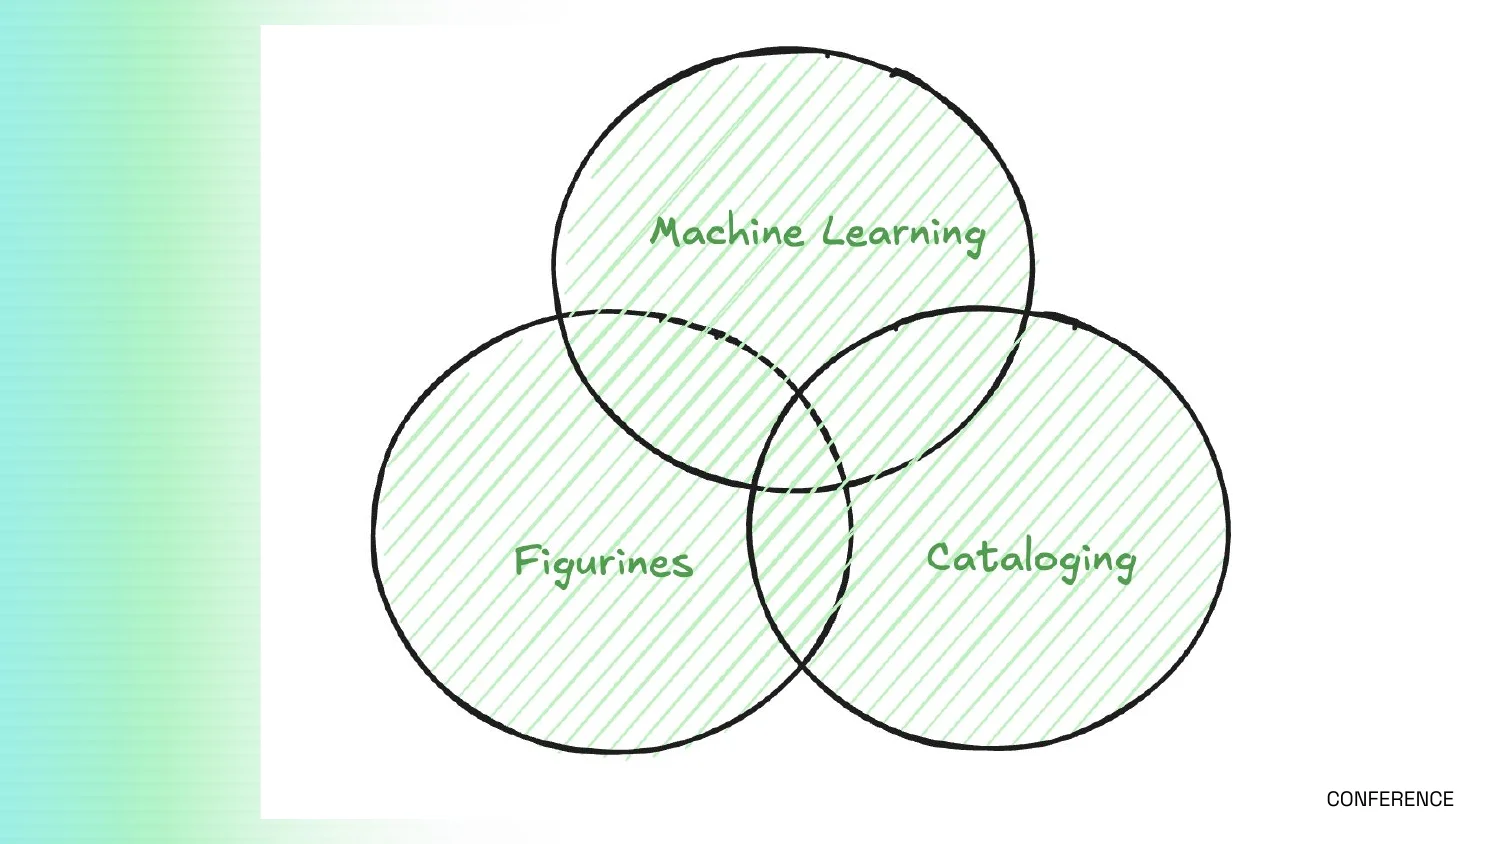
I want to push back on the idea that we're all moving in the same direction. I see sweet spots being built everywhere, where people curious enough to ask a question in the middle of their own Venn diagram expand their relevance and hold a spot that's unique to them.
Stay curious
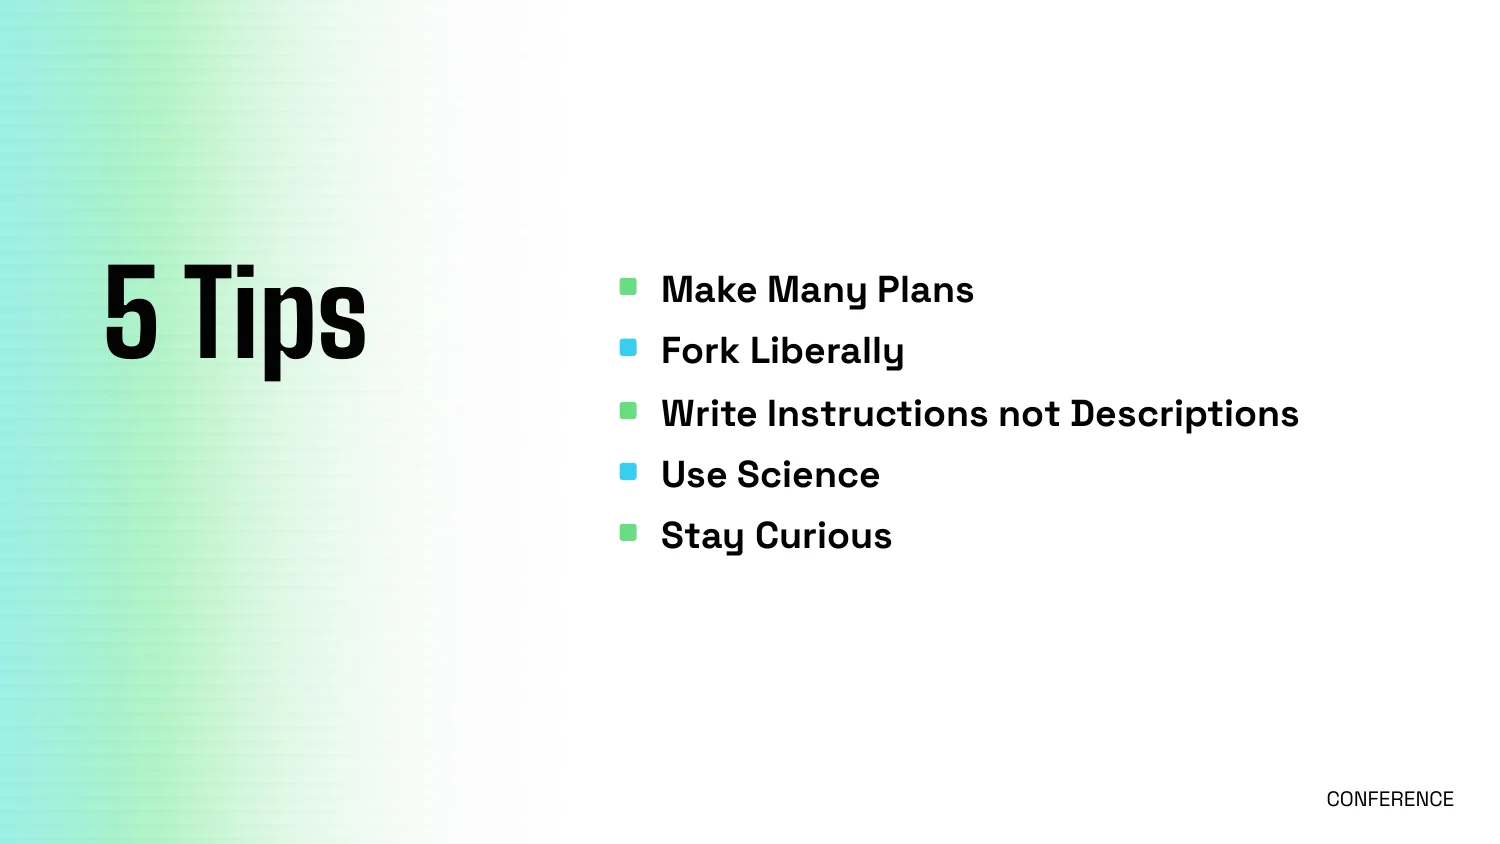
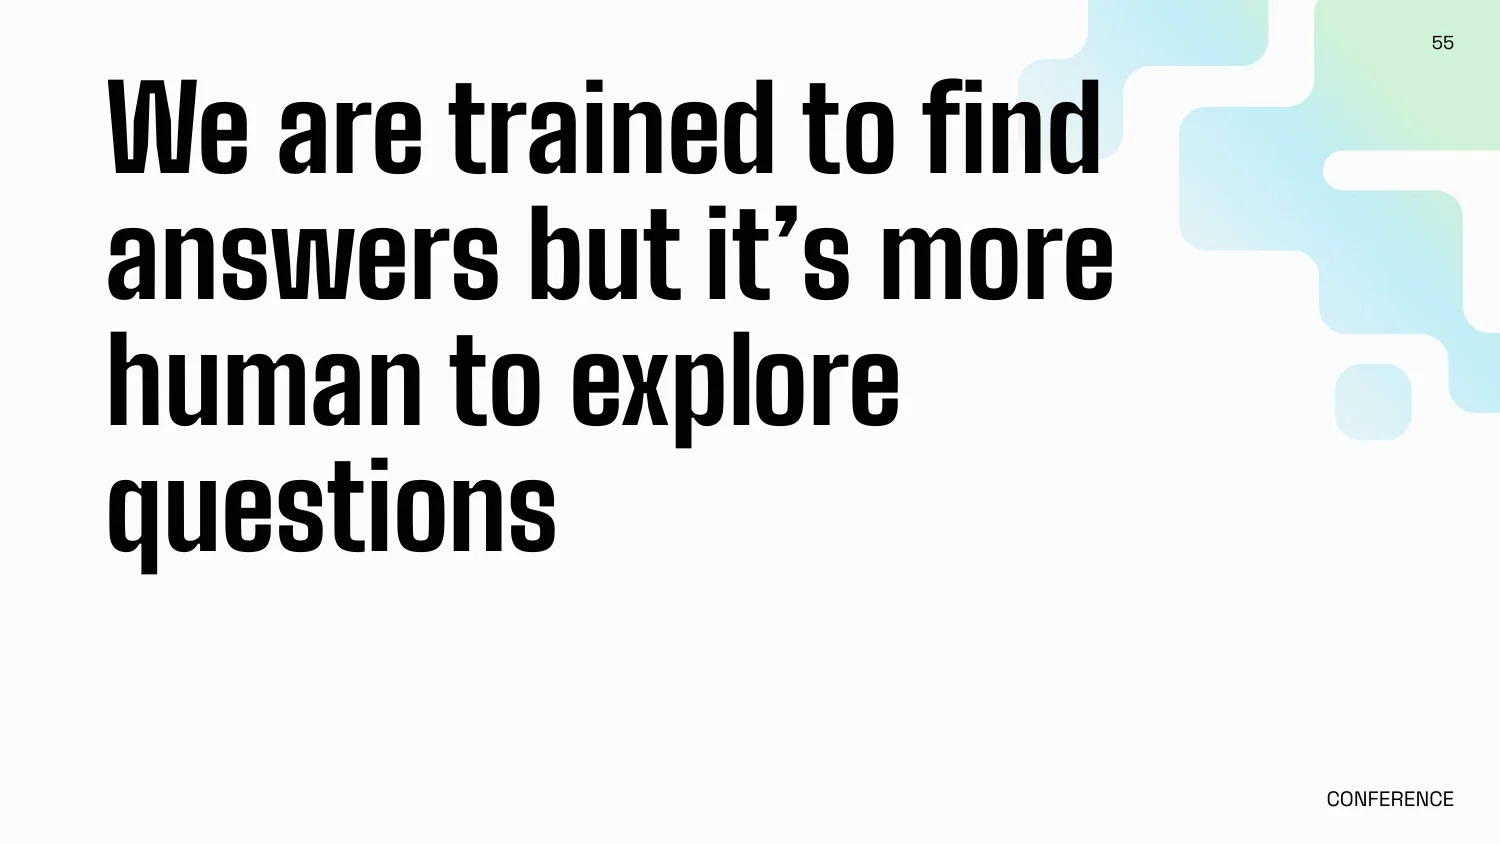
One of the great things I learned through this process is how to stay curious. As professionals, a lot of us are trained to find answers. But it's more human to explore the questions.
People to follow:
- Hoyt Emerson, thefulldatastack.com
- Simon Willison, simonwillison.net
- Eleanor Berger, everything.intellectronica.net
- Hamel Husain, hamel.dev
- Jason Liu, jxnl.co